A Snapshot of New Zealand
New Zealand is comparable in size to the United Kingdom or the Philippines. Nowhere is more than 130km from the ocean.
The climate of New Zealand is generally temperate, although weather in the far north is often subtropical during the warmer months (December to March) and there can be severe frosts in the inland areas of the South Island in winter (June to August).
Māori name – Aotearoa
Capital – Wellington
Largest city – Auckland
Official languages – English, Māori, NZ Sign Language
Population – 4,566,035 (est May 2015)
Area – 269,652 sq km
Currency – New Zealand dollar
Government – Parliamentary democracy and constitutional monarchy
History
Ancestors of Māori arrived on canoes from the Pacific about 1300AD. They called the country Aotearoa (land of the long white cloud). They lived in tribal groups, had a rich culture of stories about the land, and strong traditions of warfare.
In 1840, 500 chiefs and representatives of Queen Victoria signed the Treaty of Waitangi to protect Māori lands and rights. Promises were not always upheld and in recent years the government has reached settlements with many tribes. Today there are over half a million Māori, mostly in cities. Recently there has been a major revival of the Māori language, art, and culture.
The first European to discover New Zealand was Dutch explorer Abel Tasman, in 1642. The English navigator James Cook mapped the coasts of the country from 1769. When New Zealand became a British colony in 1840, large-scale settlement began, mainly from the United Kingdom. In the 1890s, New Zealand became the first country to give women the vote, among other liberal reforms. The country lost many men in two world wars. Today New Zealand has moved from being a British colony to an independent multicultural nation of the Pacific.
100% Pure New Zealand: Every day a different journey
Economy
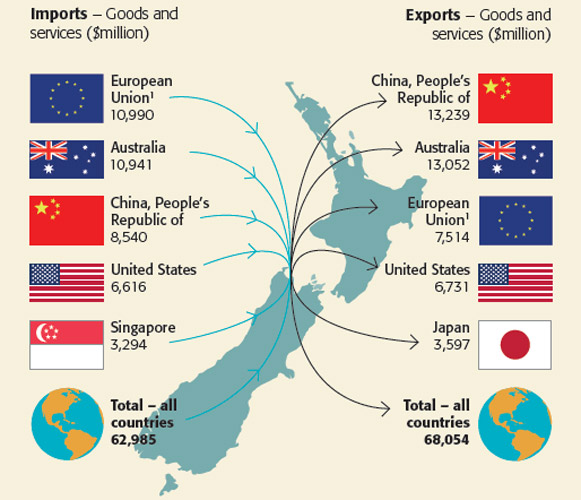
New Zealand has a market economy. For many years earnings were mainly from farm products, such as wool and dairy goods. Today these are combined with new developments such as tourism, film production, and winemaking. New Zealand depends heavily on international trade, especially with Australia, China, the United States, and Japan. Economic free-market reforms from the 1980s have removed many barriers to foreign investment.
| Gross domestic product in current prices | 2014 NZ$(million) |
| 240,000 |
| Gross domestic product by industry (in 1995/96 prices) | Growth rate 2007-12 (%) |
| Mining | 20.8 |
| Agriculture, forestry, and fishing | 17.6 |
| Financial and insurance services | 13.4 |
| Health care and social assistance | 11.5 |
| Public administration and safety | 11.3 |
| Transport, postal, and warehousing | 7.4 |
| Education and training | 6.9 |
| Professional, scientific, technical, administrative, and support services | 6.8 |
| Electricity, gas, water, and waste services | 6.1 |
| Information media and telecommunications | 5.5 |
| Arts, recreation, and other services | 4.2 |
| Retail trade and accommodation | 3.3 |
| Wholesale trade | 1.4 |
| Rental, hiring, and real estate services | -0.1 |
| Manufacturing | -8.0 |
| Construction | -13.5 |
| Gross domestic product | 3.7 |
Imports and Exports by Country
Imports
In 2012, 27 percent of all goods imported were primary products and 72 percent were manufactured goods. Petroleum and products continue to be New Zealand's highest-value import, accounting for 18 percent of goods imported.
| Main import commodities | 2012 | 2007 |
| NZ$(million) | ||
| Petroleum and products | 8,366 | 5,785 |
| Mechanical machinery and equipment | 6,071 | 5,230 |
| Vehicles, parts, and accessories | 4,882 | 4,854 |
| Electrical machinery and equipment(1) | 3,948 | 3,695 |
| Textiles and textile articles | 2,116 | 1,877 |
| Plastic and plastic articles | 1,685 | 1,567 |
| Optical, medical, and measuring equipment | 1,337 | 1,177 |
| Iron and steel, and articles(1) | 1,247 | 1,519 |
| Total – all commodities | 47,451 | 41,165 |
|
1. Values exclude confidential data |
||
Exports
In 2012, 70 percent of all goods exported were primary products and 25 percent were manufactured goods. Milk powder, butter, and cheese continue to be New Zealand's highest value export, accounting for 25 percent of goods exported.
| Main export commodities | 2012 | 2007 |
| NZ$(million) | ||
| Milk powder, butter, and cheese | 11,625 | 6,454 |
| Meat and edible offal | 5,114 | 4,609 |
| Logs, wood, and wood articles(1) | 3,060 | 2,203 |
| Crude oil | 2,023 | 475 |
| Mechanical machinery and equipment | 1,865 | 1,879 |
| Fruit | 1,587 | 1,227 |
| Fish, crustaceans, and molluscs | 1,367 | 1,153 |
| Wine | 1,177 | 698 |
| Total – all commodities | 46,688 | 34,934 |
| 1. Values exclude confidential data | ||
Society
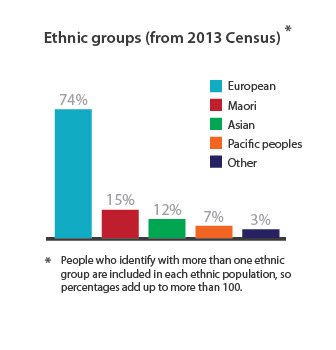
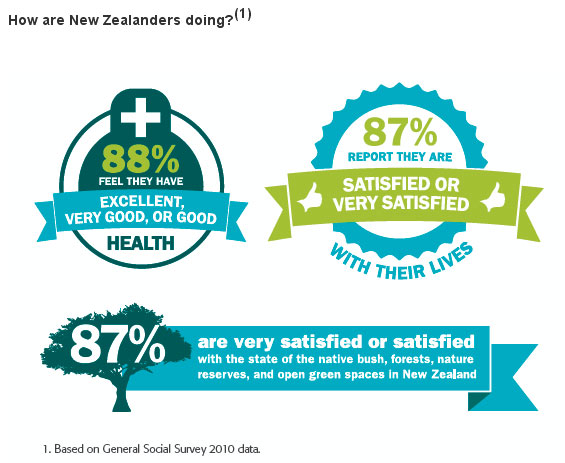
New Zealand has a similar sized population to Ireland, Singapore, and Norway. More people live in the North Island than the South Island, and far more live in the cities than in the country. Auckland, the largest city, is home to many people from the Pacific and Asia who have settled in the past 50 years. A democratically elected government contributes to schools, universities, and hospitals, so New Zealanders are generally well educated, healthy, and have a good standard of living. Christianity is the most common religion.
Social Well-being
Culture
New Zealanders enjoy having fun. Gardening, reading, walking, and going to the beach are popular leisure activities. Sport – both playing and watching – is also very popular, and while the national rugby team are world champions, golf is the most commonly played game. There is a thriving film industry, and much creative art, music, literature, theatre, and fashion design is produced here. There are museums and galleries throughout New Zealand, along with many excellent cafés and restaurants.
Earnings
| Earnings from wages and salaries | June quarter | |
| 2014 | 2012 | |
| (NZ$) | ||
| Average hourly earnings | 26.78 | 25.07 |
| Average weekly earnings | 991 | 922 |
| Median hourly earnings | 21.94 | 20.86 |
| Median weekly earnings | 863 | 806 |
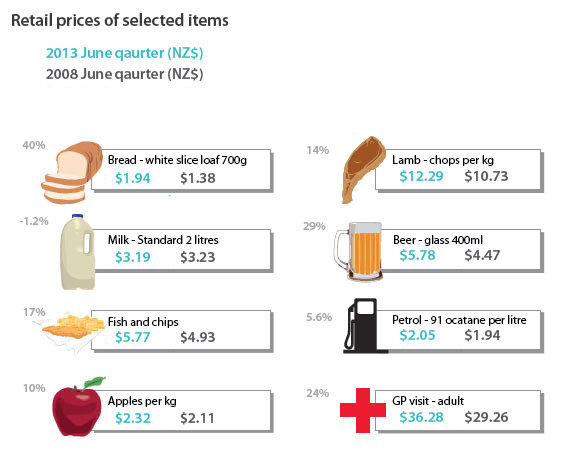
International travel
New Zealand lies around 1,600km from Australia's eastern coast (a 3 hour flight) and 9,000 to 12,000km from all Pacific Rim destinations (10 to 16 hour flight). Auckland Airport is the busiest of several international airports. Peak travel times are December to February.
| Short-term travel | 2012 | 2007 |
| (million) | ||
| Overseas visitor arrivals | 2.6 | 2.5 |
| New Zealand-resident departures | 2.2 | 1.9 |
| Top 10 visitor source countries (Country of last permanent residence) |
2015 |
| Australia | 1,304,384 |
| China, People's Republic of | 327,904 |
| United States | 237,312 | United Kingdom | 198,960 |
| Japan | 85,200 |
| Germany | 81,648 |
| Korea, Republic of | 60,416 |
| Canada | 51,680 |
| Singapore | 48,032 |
| India | 43,920 |
International Comparisons with our Top Five Visitor Source Countries
| Subject | Unit | New Zealand | Australia | United Kingdom | United States | China, PR | Japan |
| Total population (estimated) | Million | 4.43 | 22.02 | 63.05 | 313.85 | 1,343.24 | 127.37 |
| Annual rate of population change | Percent | 0.63 | 1.13 | 0.55 | 0.90 | 0.48 | -0.08 |
| Male life expectancy at birth | Years of life | 79.1 | 79.5 | 78.1 | 76.1 | 72.8 | 80.6 |
| Female life expectancy at birth | Years of life | 82.8 | 84.5 | 82.4 | 81.1 | 77.1 | 87.4 |
| % of population aged 65+ years | Percent | 13.8 | 14.4 | 16.9 | 13.5 | 9.1 | 23.9 |
| % of population aged under 15 years | Percent | 20.1 | 18.2 | 17.3 | 20.0 | 17.4 | 13.5 |
| CPI change (annual) | Percent | 1.0 | 1.2 | 2.7 | 1.9 | 2.9 | 0.2 |
| GDP per capita ( rounded)(1)(2) | US$ | 26,100 | 40,800 | 36,500 | 48,300 | 8,400 | 34,700 |
| Unemployment as % of labour force(1) | Percent | 6.6 | 5.1 | 8.1 | 9.0 | 6.5 | 4.6 |
| Employment as % of working-age population(1) | Percent | 72.6 | 72.7 | 70.4 | 66.6 | 74.2(3) | 70.3 |
| 1. Data for 2011. All other data is from 2012. 2. New Zealand data for year ended March. Other data for year ended June. 3. 2010. Sources: www.stats.govt.nz, www.cia.gov, stats.oecd.org, www.imf.org, World Bank. |
|||||||
Population
| 2002 | 3,948,500 |
| 2012 (est June 2012) | 4,433,000 |
| 2022 (projected) | 4,840,000 |
| Age group (2012) | |
| Under 15 years | 892,300 |
| 15-39 years | 1,497,000 |
| 40-64 years | 1,432,300 |
| 65+ years | 611,400 |
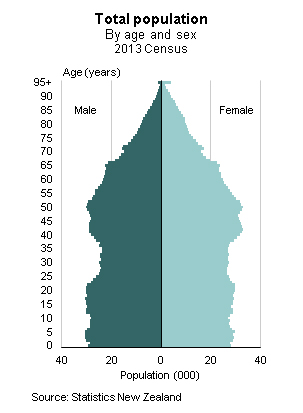
Demography
| Components of population change in the five years to 30 June 2012 | ||
| Natural increase | + 169,256 | |
| Live births | + 314,920 | |
| Deaths | - 145,664 | |
| Net migration | + 34,427 | |
| Arrivals | + 424,213 | |
| Departures | - 389,786 | |
Labour Force
| People in employment | 2012 | 2007 |
| Sector | (thousand) | |
| Personal and community services | 560.1 | 492.2 |
| Financial, insurance, and business services | 363.5 | 341.9 |
| Retail trade and restaurants | 331.1 | 344.7 |
| Manufacturing | 246.5 | 264.3 |
| Construction | 171.3 | 194.2 |
| Agriculture, mining, water, and electricity | 171.2 | 168.9 |
| Transport and communications | 154.4 | 133.3 |
| Public administration and safety | 118.0 | 119.5 |
| Wholesale trade | 98.4 | 98.2 |
| Not specified | 5.9 | 8.8 |
| Total | 2,220.4 | 2,166.2 |
Agricultural Production
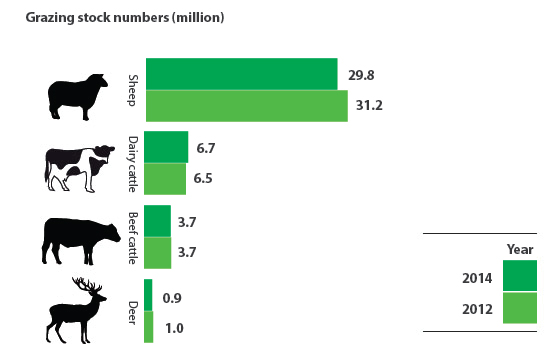
Source: Statistics New Zealand and licensed by Statistics NZ for re-use under the Creative Commons Attribution 3.0 New Zealand licence.


